 |
Questo è un esempio di poll - Ti piace il sito?
SI
NO
Questo sondaggio è riservato agli utenti registrati
Voti: 492
Sondaggi precedenti
|
|
|
I commenti possono essere distribuite con sistema RSS.
|
|
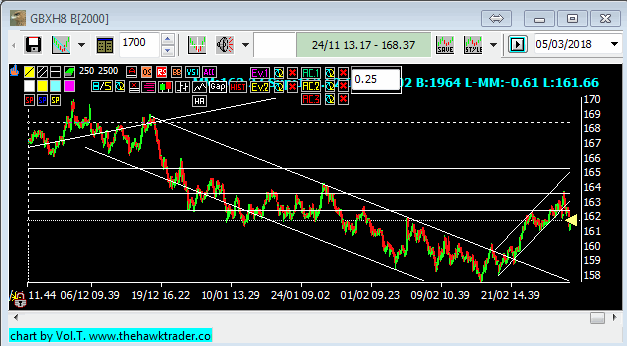
| | 917 buxl : chart molto simile al bund | | | |
|
il buxl, il 30 anni tedesco, ha un chart che si assomiglia molto al bund LINK http://www.thehawktrader.com/ita/images/20180306buxlb.gifanche qui un bel canale ascendente, rotto ieri Anche qui il buxl ritraccia il 50% della discesa. tornando al bund , con l uscita dal canale rialzista , potrebbe essersi conclusa la fase di rimbalzo (flag di continuazioe del movimento ribassista) e iniziare una nuova fase di discesa dei prezzi, con un target (calcolato sul contratto di marzo) di 163.91 (high del 1/12) - 157.26 (low del 8 febbr) = 6.65 proiettati al ribasso da 160.37 = 153.72 | |
|
 917 buxl : chart molto simile al bund frimba
| 06 mar : 09:44 917 buxl : chart molto simile al bund frimba
| 06 mar : 09:44 | Commenti: 4881
Utente 01 ago : 16:21
Replica a questo | a 12179 mi entra seconda tranche del long dax |
| | Re: 917 buxl : chart molto simile al bund frimba
| 06 mar : 10:16 | Commenti: 4881
Utente 01 ago : 16:21
Replica a questo | ovviamente s è fermato a 185 mannaggia |
| | 917 buxl : chart molto simile al bund ciacco
| 06 mar : 12:38 | Commenti: 2129
Utente 01 mar : 08:38
Replica a questo | E' uscito qualcosa che giustifichi l'apprezzamento di euro/dollaro e la forza dei futures usa?
|
| | Re: 917 buxl : chart molto simile al bund Celeste
| 06 mar : 12:43 | Commenti: 10112
Utente 14 lug : 17:33
Replica a questo | non so se può essere per la notizia che sembra che la Corea del Nord è pronta alla denuvlearizzazione se le viene garantita la sicurezza |
| | | Re: 917 buxl : chart molto simile al bund Celeste
| 06 mar : 12:44 | Commenti: 10112
Utente 14 lug : 17:33
Replica a questo | sicuramente ha avuto un impatto su usdjpy |
| | | Re: 917 buxl : chart molto simile al bund ciacco
| 06 mar : 12:52 | Commenti: 2129
Utente 01 mar : 08:38
Replica a questo | ah ok, grazie.
Il bamboccione che sia andato alle olimpiadi ed abbia visto che stanno meglio i suoi fratelli meridionali?
intanto corto a 12240 stop a 12280 target 12100.
|
| | 917 buxl : chart molto simile al bund arvtrader
| 06 mar : 12:38 | Commenti: 304
Utente 08 ott : 16:18
Replica a questo | Ciao, Antonio lo shorti anche con Draghi e dati americani alle porte? |
| 917 buxl : chart molto simile al bund Pentothal
| 06 mar : 12:40 | Commenti: 1795
Utente 20 ago : 15:45
Replica a questo | report weekly
Last week the weakest equity indices retested previous lows without breaking them while leading markets had a much better performance, in a clear sign of narrowing breadth across the asset class. Bonds keep falling while the JPY strengthens against USD. Gold continues to ready itself for a big move in my opinion while agri seems that the 10 year bear market has come to an end.
EQUITIES
DAX
Two weeks ago I said that looking at recent price action, I believed that the DAX had found a low; the index bounced for 10 days and then fell sharply once again to retest the 11500-12000 support area identified.
The good sign here is that this level has provided support once again, making it a key point to monitor.
Having said that, the relative weakness of the German index is not supportive of my central scenario, ie that the whole move since November is a wave 4 correction. As I mentioned last time I would consider buying only after the index moves above 13K; if the Dax fails again to surpass it, it means that we are now in a distribution phase, ie that the top is already in. I expect some respite in the next couple of months but will keep my eyes very open for any signs of exhaustion.
S&P 500
The S&P has corrected somewhat in the recent days but its performance has been much better than the other main benchmarks, with only emerging markets keeping pace.
While relative performance has been good, we need the index to move back above 2800 before becoming a bit more supportive.
The short vol strategy I mentioned last time was profitable and should continue to pay off if markets calm down. The reading coming from the model confirmed that this move up in volatility has been the longest since 2009 and so far the most profitable from the long side. This confirms that we have entered a new volatility regime, where volatility will raise going forward with a strong parallel with what happened in July/August 2007.
Nikkei
The Nikkei has moved in line with the other indices and has bounced from its key support area. The Nikkei has behaved recently more like the DAX, with a significant loss of relative performance vs the SPX.
As in the case of the DAX, we need to see the Japanese benchmark to move back above 23K before considering any bullish scenario. A confirmed break of key support at 20K, no matter when it happens, would imply a distribution phase akin to the one discussed for the DAX.
EEM
The EM ETF has been relatively resilient recently, driven by the high % of technology stocks that are present in the MSCI EM Index.
As per the SPX, there are no confirmed signs of a bottom but at the same time the key support area is more distant relative to the DAX or the Nikkei. This implies that in a global equity basket EM equities should be overweight, which once again fits and confirms with a late cycle scenario.
FX
USDJPY
The Dollar continues to weaken vs the JPY. After the break of key support at 108, the FX bounced back and retested this level that now becomes resistance. Given that USD JPY has been trading in a wide channel between 114 and 108 for almost a year, this move is significant. A measured target from this pattern points to 101, where we also have longer term support.
This behaviour is not a bullish signal from a macro perspective, given the role that the Asian currency has as a funding source for risk on trades.
COMMODITIES
GOLD
The daily chart shows clearly the fractal nature of the gold price since early 2017. We had three identical moves, composed by a strong, almost vertical rally, followed by a sideway 3 wave ABC correction.
The daily chart is supportive, with a continuous bullish divergence and price very close to 1350-1375 which is the latest swing high. A new high implies the break of the neckline of a long term head and shoulder bottom and it is therefore of key importance. Once again, I remain bullish and would change my stance only if we break the last low at 1300.
AGRICULTURAL COMMODITIES (DBA)
The agri sector has been in a secular bear market for a decade, falling in a 3 wave move. As always in commodities, bear markets are longer than bull markets and the last leg down of the bear is the longest of all. An observation of the monthly chart shows a deterioration of the bearish momentum since mid-2015 and bullish acceleration since early 2017. During February price for the ETF has moved up and has broken the bearish trendline that has contained the move since mid-2014.
I believe now is a very good entry point to start accumulating for people that are interested in this theme. I would expect as a minimum a retest of resistance at 23-24 for a 15-20% performance.
BONDS
BUND
The German bond future has broken its key support at 160 in mid-February and has been falling since. From a technical analysis standpoint last week we saw only a very timid rebound, immediately retraced, which does not bode well for the contract.
As I mentioned in February when the oscillator moves so much into oversold territory after never being so low, it implies that we have seen a change in the long term trend. I would therefore use any opportunity to enter a short position in this market.
US 30Y BOND FUTURE
The US long bond contract continues to fall after going through its key resistance level in February. As in the case of Germany, inflationary fears have taken over and rates are rising fast. From a technical analysis standpoint the picture is very similar to the Bund, with no signs of a bottom and a severely oversold oscillator. I have now closed my short but looking to re-establish a new position when possible.
https://postimg.org/gallery/1hzzdai6c/
|
|
|
Devi essere loggato per inserire commenti su questo sito - Per favore loggati se sei registrato, oppure premi qui per registrarti | |


